Sunday, August 22, 2010

PLETHICO PHARMA.

PLETHICO PHARMACEUTICALS 

 CMP 405   FV 10   MARKET CAP 1380 CR

IT IS MAINLY INTO HERBAL PRODUCTS AND NUTRACEUTICALS(food supplements etc)

ESTABLISHED IN 1991, PLETHICO CHANGED ITS FOCUS TO HERBAL PRODUCTS AFTER A FEW YEARS AND RECENTLY TOOK OVER A US BASED BRANDED NEUTRACEUTICAL  PLAYER –NATROL TO STRENGTHEN ITS PLACE IN THE LIFESTYLE PRODUCTS CATEGORY OF NUTRITIONAL PRODUCTS.

PLETHICO ALSO BENEFITS BY INTRODUCING NATROL’S PRODUCTS IN NON US MARKETS. IT ALSO GETS TO CROSS SELL ITS OWN PRODUCTS THROUGH NATROL’S DISTRIBUTION CHANNEL IN US.

RESTRUCTURING OF MANUFACTURING OPERATIONS:

PLETHICO HAS UNDERTAKEN CAPEX OF AROUND 200 CRORES TO SET UP MANUFACTURING BASE NEAR DUBAI, UAE AND HAS A TAX HOLIDAY OF 50 YRS.  THIS WILL SAVE THE CYCLE TIME AND BENEFITS WILL BE VISIBLE FROM FY 12 ONWARDS.

PRODUCTS:

HERBAL PRODUCTS INCLUDE TRAVISIL RANGE OF COUGH DROPS, MOUNTAIN HERBZ, NUTRITIONAL PRODUCTS LIKE COACH’S FORMULA ETC
INDIAN MARKETS NOW OFFER STRONG GROWTH POTENTIAL FOR ITS NUTRITIONAL SUPPLEMENT SEGMENT FROM NATROL STABLE.

FINANCIALS

YEAR
DEC 08
DEC 09
DEC 10E
DEC 11E
DEC 12E
SALES(CR)
904
1243
1691
1981
2225
NP
89
187
223
237
347
EPS
26
55
65
69
101
ROE
13.5
22.9
22
19.2
22.9
P/BV
3
2.1
1.6
1.2
0.9

Projections for dec10 to dec12 from crisil report

FOR Q1 ENDED MARCH 10, SALES WAS 335 CRORES, NP 58 CR (before extraordinary items) EPS FOR Q1 IS 17 (not annualised)  For quarter ended June 2010, sales were 354 crores and net profits were around 74 crores (before extraordinary but 62 crore after EO)  For six months ended june 2010, Sales were 686 crores and net profits after extraordinary( this is provision for exchange fluctuation  on account of restatement of outstanding fccbs) The fully diluted eps for six months (not annualised) stands at 33.

DEBT  AROUND 660 CRORES AS AT QUARTER ENDED JUNE 2010.

PUBLIC SHAREHOLDING IS ONLY 13%. PROMOTERS HOLD 87% STAKE BUT AS AT MARCH 2010, 90% OF THIS WAS PLEDGED. BUT AS PER BSE ANNOUNCEMENT, IN MAY PLEDGING HAS COME DOWN TO AROUND 80% DUE TO REVOKING OF PLEDGE.

POSITIVES:

GOOD GROWTH PROPSECTS FOR THE COMPANY DUE TO NATROL ACQUISITION AND ITS SYNERGIES
MARGIN IMPROVEMENT EXPECTED POST 2011 DUE TO BENEFITS OF DUBAI MANUFACTURING BASE
CHEAP VALUATIONS OF AROUND 6-7  PE—CHANCES OF RERATING ARE THERE

NEGATIVES:

PROMOTER PLEDGING
OUTSTANDING FCCB FOR WHICH COMPANY HAS BEEN MAKING PROVISIONS.

TECHNICALS:

THE STOCK WAS  STUCK IN A VERY NARROW RANGE OF 330 TO 410 FROM DEC 09 ALMOST SINCE 7 -8 MONTHS.  RECENTLY STOCK MADE A HIGH OF AROUND 440 AND TAKING SUPPORT FROM THE EARLIER RESISTANCE BAND OF AROUND 380-400.




Saturday, August 21, 2010

INTERESTING CHARTS


THIS IS CHART OF GILLANDERS SHOWING AN INVERTED HEAD AND SHOULDERS PATTERN. YELLOW LINE IS NECKLINE ON LINE CHART (BASED ON CLOSING PRICES) AND BLUE LINE IS NECKLINE ON BAR CHARTS. BREAKOUT LEVELS AS MENTIONED IN THE WRITE UP ARE AROUND 185-190 ABOVE WHICH THERE COULD BE GOOD UPSIDES.


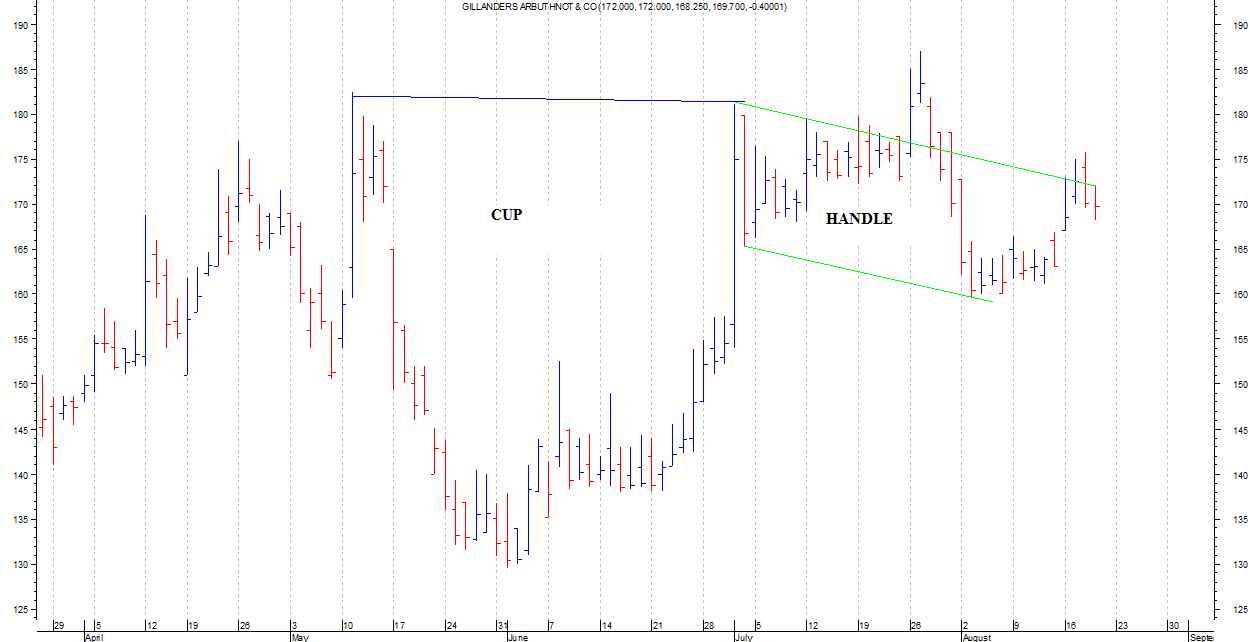
THIS IS A DAILY CHART OF GILLANDERS SHOWING CUP AND HANDLE PATTERN. AGAIN HERE BREAKOUT LEVELS ARE AROUND 180-185.


THIS IS AN ATTEMPT TO LABEL LAKSHMI ENERGY WAVE COUNTS. WAVE COUNTS ARE TRICKY THINGS. I HAVE MADE AN AMATEUR ATTEMPT TO PUT THE CHART INTO PERSPECTIVE.  AS SEEN ABOVE THERE WAS A STRONG FIVE WAVE RALLY WHICH TOOK THE STOCK TO ITS HIGHS ABOVE 300 LEVELS AND THIS WAS FOLLOWED BY A SHARP A-B-C CORRECTION, WHICH SEEMS TO HAVE ENDED AT AROUND 63. SINCE THEN THE STOCK WENT UP TO AROUND 175 LEVELS WHERE IT CREATED A TOP.  FIRST WAVE IS USUALLY A WEAK WAVE WITH VERY FEW PEOPLE PARTICIPATING.    WAVE TWO HERE IS A SHARP  CORRECTION DOWN TO AROUND 91 LEVELS WHICH IS USUALLY THE NORM IN WAVE TWO. A DOUBLE BOTTOM OF AROUND 91  WILL BE CONFIRMED ON CHARTS IF THE STOCK MOVES ABOVE 113-114 LEVELS WITH GOOD VOLUMES.  IF THAT HAPPENS, WE MIGHT PRESUME THAT WE ARE IN THE BEGINNING PHASE OF WAVE THREE. EARLY PHASE OF WAVE THREE IS USUALLY SLOW AND GRADUALLY IT MAKES IT TO THE TOP OF WAVE ONE. 


WE NEED TO SEE HOW THE PATTERN DEVELOPS. THIS IS JUST A HYPOTHESIS WHICH NEEDS TO BE OBSERVED. 


THIS IS A WEEKLY CHART OF NIFTY INDEX WHICH SHOWS IT IN A SLIGHTLY UPWARD SLOPING CHANNEL SINCE LAST ONE YEAR .  WE ARE NEARER TO THE UPPER TRENDLINE WHICH HAS IN THE PAST OFFERED RESISTANCE. NEED TO WATCH 5550-5600 FOR ANY RESISTANCE TO THIS LATEST UPMOVE.

Friday, August 20, 2010

GILLANDERS ARBUTHNOT -- growth cum value play

GILLANDERS ARBUTHNOT   

cmp 168, market cap 242    crores.

This company is a conglomerate of various businesses which consists of
Tea,  Yarns, Construction, Marketing, Waldies, Property, Power Plant.

CONSTRUCTION:

Modern India Construction Co. (MICCO), a Unit of Gillanders Arbuthnot & Co. Limited (GACL) , Kolkata, belongs to the KOTHARI GROUP.   MICCO has expanded in the last 18 years to become one of the leading engineering and turnkey contracting company in India. MICCO's expertise incorporates absorption of Basic Design of various Plants from the World Leaders of the same and translation of the design into a properly detailed engineered plant.

FABRICATION DIVISION  at Sodepur makes Tanks, Pressure Vessels, Chimneys, Bunkers etc., -Heat Exchangers, -Building & Technological Structures, -Electric Arc Furnaces and Walking Beam Furnaces, -Power Winches, -HT & LT motor frames, -Ship Bulkhead modules.

TURNKEY/EPC DIVISION  is involved with Blast Furnaces,  Reheating Furnace, Desulphurisation of Hot Metal, Coke Oven Battery,  Skin Pass Mill, Cold Rolling Mills, Continuous Galvanising Lines, Gasholders, Water Cooling Systems in BF & LD, Material Handling Plants, Structural Steelwork, Piping.
MICCO has an well-equipped Design /  Drawing office at Kolkata, equipped with Latest AUTO-CAD manned by qualified Engineers and Draughtsman. MICCO is doing Mechanical, Piping, Structural, Electrical, Instrumentation, Automation drawings for Consultants and Technology Partners like DCL, EIL, TPE (Russia), MECON, DASTUR CO., CLAYTON WALKER (UK), IHI (Japan), KUETTNER (Germany), BRICMONT (USA).
TEA DIVISION comprises of tea gardens measuring a total grant area of 5874 hectares and has various tea estates in Betjan, Tengpani, Jutlibari in Assam and Gairkhata in Doars and Taipoo in Bagdogra.
WALDIES It is one of the largest manufacturers of Lead Oxides and Stabilisers for PVC Industry. Its factory is located on the bank of River Ganges around 14 Kms from Kolkata. It is the most respected name in the industry and is well known for its high quality products 

YARN DIVISION produce varieties Yarn for Domestic and Exports market. They  have two spinning mills known as GIS Cotton Mill at Champadany, near Kolkata, West Bengal, India and another one as North India Spinning Mill at Ahmedgarh, near Ludhiana, Punjab, India.

MARKETING DIVISION  The company is active in marketing various products connected particularly with Building Industry mainly in Southern and Western regions of India. They market various products like Supercem—paint related brands,  CICO – water proofing compound, Tapecrite,  and various other numerous brands. They market 3M products in Tamilnadu.

PROPERTY DIVISION owns and rents Gillanders house at Netaji Road in Calcutta  and POWER DIVISON has a 6.5 MW co-generation power plant at Akbarpur in Dist Sangrur Punjab.

FINANCIALS:

CMP  AROUND 168, SHARE CAPITAL AROUND 16.23 CRORES,  MARKET CAP AROUND 242 CRORES

YEAR
04
05
06
07
08
09
10
Q1FY11
SALES
51
240
258
269
408
487
613
158
NP
-1.64
2.81
4.86
5.93
14.6
16.2
25.3
11.3

Before jumping the gun about FY 11, one needs to consider that they report losses during March quarter due to lacklustre performance of tea division. But overall the trend in sales and profits seems to indicate good growth performance.

DIVIDEND declared for FY 10 is Rs 5.

DEBT FOR FY 09 WAS AROUND 183 CRORES.

PROMOTER HOLDING IS AROUND 68.62%, NO PLEDGING.

STOCK IS AVAILABLE CURRENTLY CUM BONUS WITH ONE SHARE FOR EVERY TWO SHARES HELD.

TECHNICALS:

Here there are two different interesting patterns which I have posted on theequitydesk.

First is an inverted head and shoulders pattern on long term charts where breakout levels are around 180-190, and a break above these levels should target much higher levels.

Secondly on the daily charts it has formed a bullish cup and handle pattern, again breakout levels of this are around 180-185.  Link  http://www.theequitydesk.com/forum/forum_posts.asp?TID=339

Gillanders seems to be a combination of deep value cum growth play.

ACKNOWLEDGEMENT:  THIS STOCK WAS  BROUGHT TO MY NOTICE BY A FRIEND VIVEK SUKHANI. THANKS VIVEK SUKHANI.

DISCL:  I OWN THE STOCK.


Thursday, August 19, 2010

ANDHRA PETRO

ANDHRA PETRO

The Andhra Petrochemicals Ltd.   (APL)   was promoted by     The Andhra Pradesh Industrial Development Corporation   (APIDC)   and   The Andhra Sugars Ltd.   (ASL)   in   1984 as joint sector Company.    Subsequently the structure of the Company has changed into an assisted sector.

APL was established with a licence capacity to produce   30,000   MTPA of Oxoalcohols at Visakhapatnam,  Since then the capacity has been expanded to 73000 MTPA by expansion and has been operationalised since May 2010.

PRODUCTS

The company manufactures OXO-ALCOHOLS and has a market share of around 27% with balance demand met by imports .
FINANCIALS

EQUITY AROUND 85 CRORES,  cmp around 22-23, market cap of about 195 crores

Quarter
Mar 09
Jun 09
Sep 09
Dec 09
Mar 10
June 10
Sales
41
45
54
37
1.6
73
Interest
0.36
0.38
0.53
0.36
0.07
3.6
NP
1
-1.65
2.46
-1.73
-4.43
4.31

Now this was a stock I posted on TED  when it was around 12-13 levels in Nov 09.


Now comes the interesting part.

The plant was closed in Nov 09 for the purpose of assimilating the new capacities with the existing capacities. It remained shut till May 2010 when it was re-opened.

In fact this was the exact announcement:

With reference to the earlier announcement dated November 10, 2009, Andhra Petrochemicals Ltd has now informed BSE that the Modernisation-cum-Optimisation of the Oxo alcohol Plant has been implemented with an investment of around Rs. 275 crores and the Expanded Plant with a capacity of 73,000 MT per annum has commenced commercial production from May 01, 2010.

Now if you look at the June qtr results, the production effectively took place only for 1 month and company clocked a turnover of 73 crores.  So for Sep quarter, when effects of full expansion are reflected, one only needs to guess where the sales figures will go. 
The promoters raised their stake by around 10 lac shares between March 10 to June 2010.

And since then prices have moved up from levels of around 13.14 to currently 22-23. 

INVESTMENT ARGUMENT:

The company has completed its full  expansion and is set to report good robust numbers going forward, following which profits also are expected to increase.  The markets seem to have factored in the expansion benefits to some extent but I feel, that better results would lead to higher levels in this stock.

TECHNICAL VIEW:

The stock has been in an upward sloping rising channel with resistance pegged at around 26 and support at around 20 levels  If and when the resistance of 25-26 is crossed, there could be significant upsides.

Wednesday, August 18, 2010

LAKSHMI ENERGY AND FOODS -- contra buy

LAKSHMI ENERGY AND FOODS  cmp 95, fv Rs 2, market cap around 600 crores.

The company is the biggest processor of non-basmati rice in India and has a lot of value addition during the processing. It generates biomass power from husk of rice.

WHAT HAS GONE WRONG THIS QUARTER

During the third quarter ended June 2010 (year ending September 2010) the company reported excellent sales figures amounting to 338 crores compared to 178 crores for June 09.  This showed a growth of 90% y-o-y and 40% q-o-q. 

PUSA Basmati contributed 70% to net sales with robust sales in domestic as well as export markets.
The margins took a strong beating in this quarter because the company decided to reprocess unsold finshed goods inventory and sell it. This inventory was at a higher price due to higher rice prices which subsequently fell from around 62 per kg to 48 per kg. This lead to higher raw material cost. Going forward, company is likely to procure raw material at lower prices and sell it at normal margins.

Energy division showed sales of 27 crores which was up around 70% q-on -q because of higher realisation of 6.38 per unit of electricity. For 9M ended June 2010, the avg realisation was around Rs 5.64 per unit.  Going forward, realisation of power division is likely to stabilise at higher levels witnessed in June qtr.

For nine months ended June 2010, company posted sales of 782 crores compared to 505 crores for 9M ended June 2009.  Net profits were at 64.7 cr as compared to around 62 crores for 9M ended june09.  EPS for 9M ended June 10 was around 10 per share.

WHAT CAN IMPROVE

1.       Company plans to launch rice in retail segment under its brand Lakshmi Foods, beginning with Delhi and ultimately covering metros and a total of 7-8 cities by end of FY 10.

2.       There could be margin improvement in last quarter (which is usually the best quarter every year) due to lower raw material prices and stable power realisations.

3.       Launch of retail brand could reduce dependence on FCI offtake of its products and hence reduce volatility in its earnings.

4.       Conservative estimates would lead to eps of around 15-16 per share with possibility of upside surprises, unless something goes wrong drastically. Sales for fy 10 ended Sep are projected as 1100-1150 crores and net profits in range of 90-100 crores. (source: reports of edelweiss and crisil)

INVESTMENT ARGUMENT:

Looking at the above projections,  here there is a company available with a very good business model, passing through a rough patch and still delivering a PAT of around 90 crores minimum with a market cap of 600 crores.  And there seem to be better times to come with its retail launch of products set to take place sooner or later.

RISKS:

Delay in retail launch could derail the calculations to some extent
Raw material prices theoretically could play spoilsport.

disc: I have a position in the stock.

PS   I had posted the synopsis on TED in June 09 when the price was around 75-80. The company had a good few quarters after this and the stock reached a high of around 175 and has subsequently fallen to the current levels of around 90-100, where it seems to be consolidating.

TECHNICAL VIEW:

The stock has seen a strong run up from around 63 where it formed a bottom to around 175 and has subsequently fallen to around 95 levels currently. It seems to be consolidating in the 90-100 range currently.  If things fall into place fundamentally, we may be looking at wave 3 up in the medium term which is usually quick in terms of value and time. (I am no expert in elliot wave analysis but this is how the picture looks to an optimistic amateur analyst)